Data Portal - Product Detail Page
CVS
Problem
Showing all the information at once can be overwhelming. Different sets of users only care about certain parts of the data, but all users need to be able to see and access the same information.
Overview
Each asset has its own set of details. This includes specifics about the asset as well as tracking any changes or movement of the asset. All of the information needs to be viewable in one place.
USER INTERVIEWS and card sort
PROMINENT INFORMATION PULLED FROM USER INTERVIEWS
Both consumers and managers:
Need to see the movement and migration of the asset. Example - if the table started in Hadoop and moved to GCP what parts of the metadata have changed and where to find the usable table.
Want an overview of the asset. Security classification and encryption was another high priority element both users needed to see up front.
After collecting all the pieces the users mentioned as well as some items collected from tools they are using now, I conducted a card sort to see the most natural grouping of information.
Managers:
Want to see a holistic history of the asset. Who made changes and when.
Managers of Schemas (a specific asset) want to know how improving their metadata affected the usage. They wanted to know and report the value of their schema.
Consumers:
Want help with relevant queries and how other prominent users have used the data in queries.
In need of contact information for questions and nuances around certain assets.
Wireframes
I put information into a tab structure as an MVP model. Knowing that as the Data Portal grows the content and naming of the tab structure will change so that the page doesn’t end up with too many tabs. We also decided that there should be a consistent section at the top that showed the name and description with actions buttons.
Detail Tab
The main landing page tab holds all the baseline info important to most all users. It also holds the contact information of the owners and stewards of the asset. Detail is also where nested data is shown. During discussions with product and engineering on what we could realistically pull in for the columns we decided to release with the shown set of columns. More research is planned to get the best information slotted in the tables.
Queries
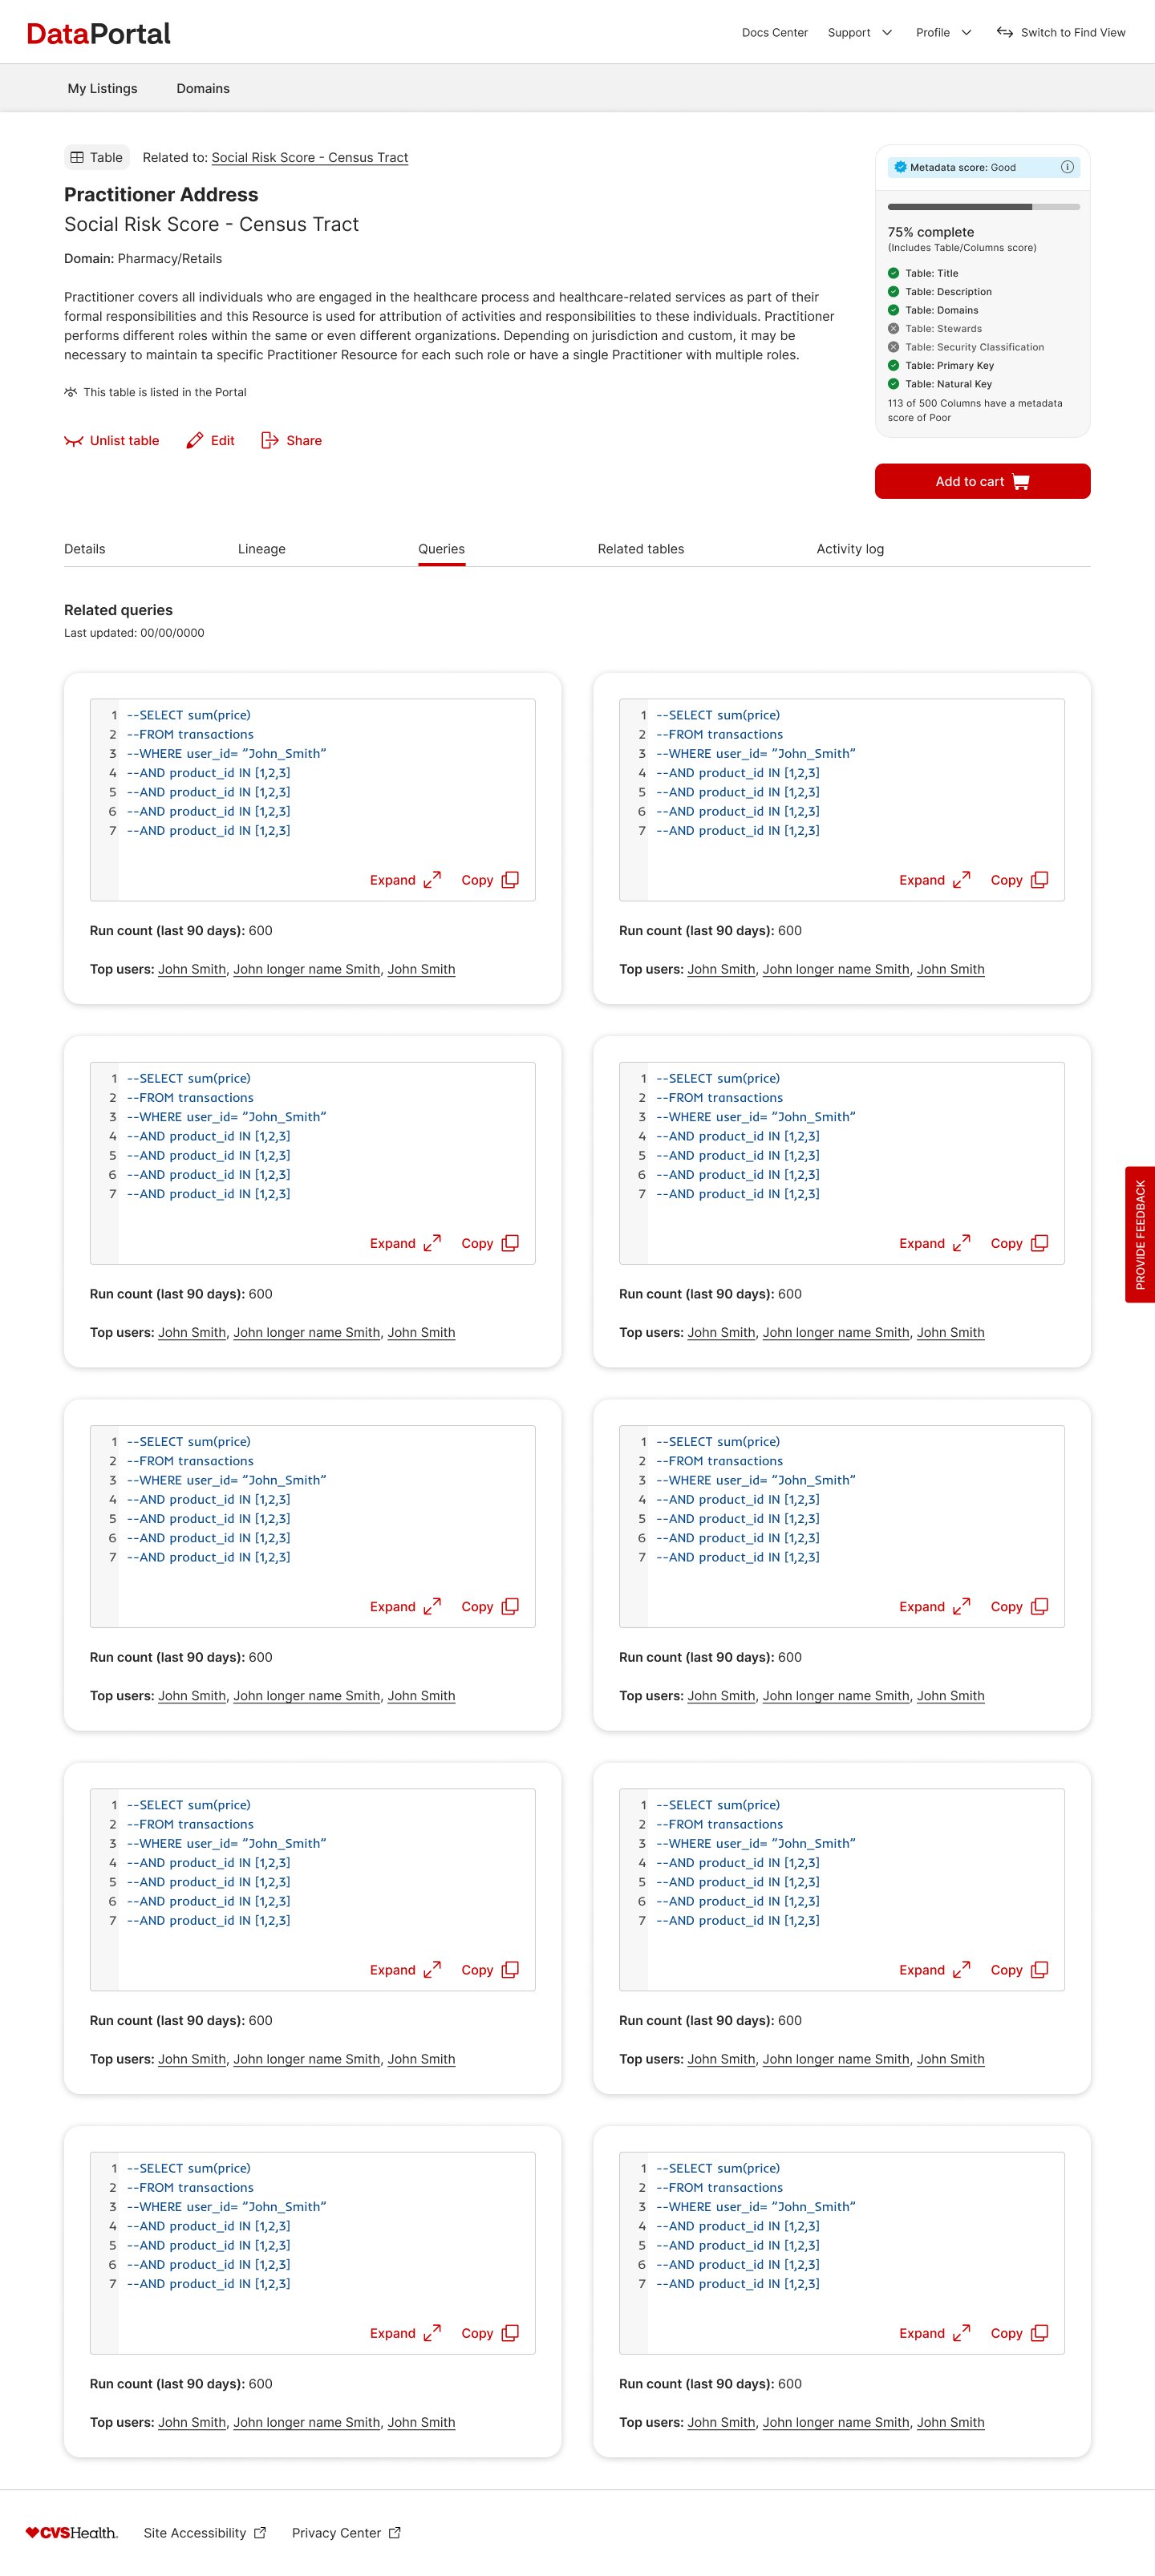
The top queries also got their own tab. Each query has an expandable view as well as a quick way to copy so the user can easily place it in their control system to run. I also put a top users section where the consumer can reach out to top users on how they are using the query. I added in the run count for the past 90 days, to show which queries are used most often to be the most impactful. I also worked with engineering to filter out system ran queries as those runs would not have a top user and would have a larger run count to make them look more helpful than they actually are.
Activity history
Because of how assets are nested we had to account for not just the higher level asset but the children assets in activity history. I added in an asset and name column to call out what asset it was and if it was a child asset the name of the child asset. I also had to collect all the different types of changes or edits that could be made (replace, add, delete, remove).
The other challenge with activity history was bulk update. We didn’t want to have to repeat the same row edit on 100 different assets. Instead we collected all the names of the bulk edit and put them in a modal.
Usage stats for Schema and Lineage are still in development and research stages.


